After replication is up and running, it is important
for you to monitor it and see how things are running. You can do this in
several ways, including using SQL statements, SQL Server Management
Studio, and Windows Performance Monitor. You are interested in the
agent’s successes and failures, the speed at which replication is done,
and the synchronization state of tables involved in replication. Other
issues to watch for are the sizes of the distribution database, growth
of the subscriber databases, and available space on the distribution
server’s snapshot working directory.
Replication Monitoring SQL Statements
One way to look at the
replication configuration and validate row counts, for example, is to
use various replication stored procedures, including the following:
sp_helppublication— Information on the publication server
sp_helparticle— Article definition information
sp_helpdistributor— Distributor information
sp_helpsubscriberinfo— Subscriber server information
sp_helpsubscription— Subscription information
These stored procedures
are all extremely useful for verifying exactly how the replication
configuration is really configured. If you execute these stored
procedures (from the publication database), you get a great
documentation of your complete replication topology that can be included
in run books or other system documentation. Here’s what you might do to
see how the current replication configuration has been built out:
use AdventureWorks2008
go
exec sp_helppublication
exec sp_helparticle @publication='PUBLISH AdventureWorks2008 - Transactional'
exec sp_helpdistributor
exec sp_helpsubscriberinfo
exec sp_helpsubscription
go
It yields this result:
1 PUBLISH AdventureWorks2008 - Transactional       0     1     1     0
----------------------------------------------------------------------
1  Address            [Person].[Address]             Address
2  AddressType        [Person].[AddressType]         AddressType
3  AWBuildVersion     [dbo].[AWBuildVersion]         AWBuildVersion
4  BillOfMaterials    [Production].[BillOfMaterials] BillOfMaterials
5  Contact            [Person].[Contact]             Contact
6  ContactCreditCard  [Sales].[ContactCreditCard]    ContactCreditCard
7  ContactType        [Person].[ContactType]         ContactType
...
In addition, sp_replcounters shows the activity of this replication session. You can see the volume of traffic and the throughput here:
It yields this result:
database repl_trans rate trans/sec latency (sec) etc.
AdventureWorks2008    0       1562.5    1.243
For actual row count validation, you can use sp_publication_validation, which goes through and checks the row counts of the publication and subscribers:
exec sp_publication_validation @publication
    = 'PUBLISH AdventureWorks2008 - Transactional'
go
It yields this result:
Generated expected rowcount value of 19614 for Address.
Generated expected rowcount value of 6 for AddressType.
Generated expected rowcount value of 1 for AWBuildVersion.
Generated expected rowcount value of 2679 for BillOfMaterials.
Generated expected rowcount value of 19972 for Contact.
Generated expected rowcount value of 19118 for ContactCreditCard.
Generated expected rowcount value of 20 for ContactType.
Generated expected rowcount value of 238 for CountryRegion.
Generated expected rowcount value of 109 for CountryRegionCurrency.
Generated expected rowcount value of 19118 for CreditCard.
Generated expected rowcount value of 8 for Culture.
Another way to monitor replication is to look at the actual data being replicated. To do this, you first run the SELECT count (*) FROM tblname
statement against the table where data is being replicated. Then you
verify directly whether the most current data available is in the
database. If you make a change to the data in the published table, do
the changes show up in the replicated tables? If not, you might need to
investigate how replication was configured on the server.
If you are allowing updatable subscriptions, the replication queue comes into play. You need to learn all about the queueread
command prompt utility. This utility configures and begins the queue
reader agent, which reads messages stored in the SQL Server queue or a
Microsoft message queue and applies those messages to the publisher.
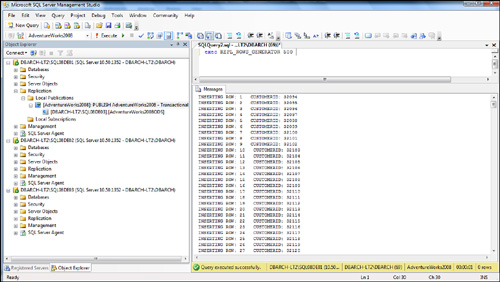
To help you visualize how replication works, and to help you monitor replication, the following sample stored procedure, called REPL_ROWS_GENERATOR, takes one parameter (the number of rows [new customers in the Customer table] you want to have inserted at a time) and generates new rows in the Customer
table that can reflect different data activity that will be published :
Use AdventureWorks2008
Go
--------------------------------------------------------
-- generate 500 new customers for replication testing --
--------------------------------------------------------
exec REPL_ROWS_GENERATOR 500
go
This example shows how to
execute this stored procedure to insert 500 new customers. If you don’t
supply any parameter, the default is 100 new customers. Try it out.
The following messages appear after you execute the REPL_ROWS_GENERATOR stored procedure:
INSERTING ROW: 1
INSERTING ROW: 2
INSERTING ROW: 3
INSERTING ROW: 4
INSERTING ROW: 5
INSERTING ROW: 6
INSERTING ROW: 7
INSERTING ROW: 8
INSERTING ROW: 9
INSERTING ROW: 10
...
INSERTING ROW: 500
Figure 1 shows this stored procedure.
Monitoring Replication within SQL Server Management Studio
As you can imagine, SQL
Server Management Studio provides considerable information about the
status of replication. Most of this information is available via
Replication Monitor. In Replication Monitor, you can see the activity
for publishers, distributors, and subscribers; you can see all agent
details; and you can configure alerts.
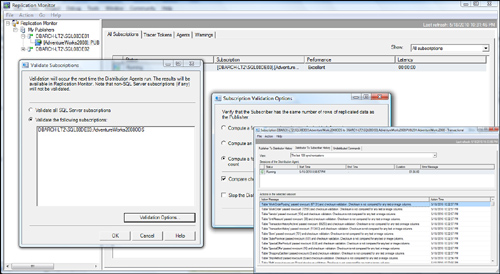
Through Replication Monitor,
you also can invoke validation subscriptions processing to see if
replication is in sync. You just navigate to the publication whose
subscription you want to validate, right-click, and choose Validate
Subscription option. This allows you to verify that the subscriber has
the same number of rows of replicated data as the publisher. You can
validate all subscriptions or just a particular one. Validation options
are extensive and include using fast row count methods, actual row count
methods, and even checksum comparisons of row data. This is a huge
feature for SQL Server 2008. Figure 2 shows the results of running a complete subscription validation.
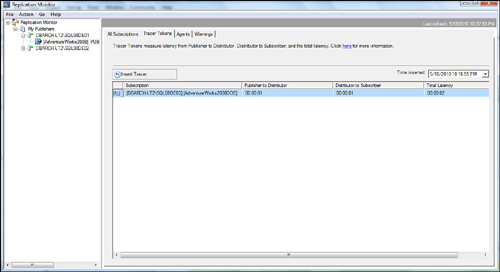
Another great feature to help
monitor replication is tracer tokens. Essentially, you create a marker
(called a token) that flows through the full replication topology (from
publisher to distributor to subscriber). It does not affect data tables!
This flow is monitored and measured, down to the millisecond, and is
for a specific publisher-to-subscriber path. Figure 3
shows the Tracer Tokens tab of the Replication Monitor and the Insert
Tracer button that you can click to fire off the token through the
topology. You can click this button to quickly see where bottlenecks
exist (for example, from publisher to distributor, from distributor to
subscriber) and the latency of the data flow along the way. In this
example, it took the tracer token 2 seconds in total to traverse from
the publisher to the distributor and to the subscriber.
Troubleshooting Replication Failures
Configuring
replication and monitoring for successful replication is relatively
easy. The fun begins when failures start arising. Replication Monitor
pays for itself quickly. Red flags begin appearing to indicate agent
failures. Depending on how you have the alerts defined, you probably
also get numerous emails or pages.
The following are the most common issues you find with data replication:
Data row count inconsistencies, as discussed in the preceding section
Subscriber/publisher schema change failures
Connection failures
Agent failures
For the conventional
replication situations, if the problem is with the validation of
subscriptions processing, it is usually best to resynchronize the
subscription by dropping it and resubscribing or by reinitializing the
subscription.
Another common issue is that
the SQL Server Agent service doesn’t start. Manually attempting to
restart this service usually shakes things loose. Sometimes an object on
the subscriber becomes messed up. The solution is usually to create
that object again and reload its data via BCP or IS. Then you can
resynchronize the subscription. In such a case, the subscription
included this object originally, but it has become invalid in some way.
With a heterogeneous subscriber, you often see connection errors due to
invalid login IDs used in the ODBC connection. The quick fix is usually
to just redefine the ODBC data source connection information.
A much more complex
failure can arise when the replication queue is stopped due to some type
of SQL language failure in the command being replicated. This situation
is extremely serious because it stops all replication from continuing,
and the distribution database starts growing rapidly. Replication keeps
trying to execute, but it fails each time. This situation is essentially
a permanent roadblock. The solution is to locate the exact transaction
in the distribution database and delete it physically from the
transaction queue. This action is highly unusual, but it is necessary
when the circumstance presents itself. First, by looking at the error
detail information in the distribution agent history, you can isolate
the SQL statement on which it is choking. Then you have to find it in
the distribution database. You start by executing the sp_browsereplcmds stored procedure from the distribution database. This gives you all the replication transactions (that is, each xact_seqno)
along with the associated SQL command. You have to pump this to a text
file for searching. You then search this data for the matching SQL
command. When you locate it, you look for its associated transaction
number (xact_seqno). You use this xact_seqno value to delete it from the Msrepl_commands
table in the distribution database. This frees up the roadblock. You
see this type of issue only about once every six months, if at all (it
is hoped).